Here is a product that I’ve been meaning to do a review of for a while, dotTrace 3.1. A .net code profiling tool from JetBrains. In other words, dotTrace helps you figure out where your code is slow. How is that not handy. As an added bonus, it will tell you what your application’s memory usage is doing as well.
I’ve been playing around with it for a month or so now and it is wonderful to have. This isn’t the sort of tool that you whip out all the time, but when you need it, you need it. No doubt there.
But lets throw out some software development methodologies first.
Rule #1: Premature optimization is the root of all evil. (Donald Knuth said that back in 1974 if you have any issues with it). Again, this isn’t a tool that you should be using all the time.
Rule #2: If you don’t measure, you don’t know. The is the heart of the engineering part of software development. At my last Boise Code Camp (March 8, 2008) I had two separate people complain to me about how slow .net was for WinForms. OK, so what part was so slow? What were you trying to do? Was the database properly indexed? Did you have measurements about what is slow? Nope. Nothing. I can’t comment on their code, I didn’t see it. But for all they know the problem could have been anywhere in their code. It could have been the database was improperly tuned, it could be they were running on really slow hard-drives. They simply did not know. To me that is not acceptable.
Rule #3: Where-ever you thing the problem is — is wrong. This really is just a continuation of Rule #2. But it is directly related to how many people I’ve talk to that get disgusted with me when I talk about ORMs. “They are too slow” is the answer I get. Accordingly, I’ve talked to two developers for whom that was true, for the particular application they were writing. For the rest, their app was slow, so they were assuming it mush be the fault of the ORM — and telling everyone else as much as well. Also not acceptable. They did not know where their problems actually were.
I’ve made this mistake too many times to count myself. Spending countless hours optimizing and tuning code that had no net effect in the end. I hadn’t tested, and it proved to be wrong. And how many of you checked that code in anyway, because you didn’t want to see all that time go to waist?
Rule #4: This isn’t the only tool you should be using. A properly written application should be testable with unit tests. It should also have unit tests. If you find the problem with your code, you should be able to reproduce it with your unit tests, measure it from there, and then possibly fix it. That is the heart of the Red-Green-Refactor motto of TDD. A code profiler will help you FIND the problem. Unit Tests should help you FIX the problem and know it is fixed.
Enough already, on to the review
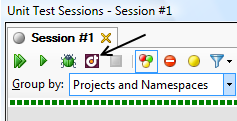
First of, on Rule #4: DotTrace paired with ReSharper actually make a wonderful paring. The two integrate in together so you can launch DotTrace from your test cases in the ReSharper unit test runner. That is just plain beautiful.
On Rule #3: DotTrace’s UI is a tree structure that really does allow you to follow the bread crumbs to find where the performance problems are. Here is a look at SubSonic SubStage (a nice little application that helps generate your SubSonic files for you, as well as show results of the tables).
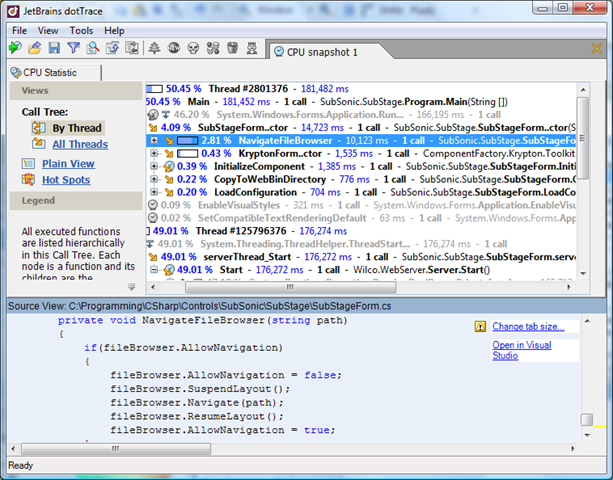
I was looking at the boot up time of the application. Using the tree and the small iconography I was quickly able to figure out that a good chuck of time was being spent in the NavigateFileBrowser method. Below the tree view a listing of the code is displayed as well.
Another quick note about the display, the grayed out text is system code. DotTrace doesn’t detect a pdb, so it can’t show you the code that is being executed.
On Rule #2: You can store snapshots — and compare them. Actually there are three ways to compare snapshots. Through the call tree (showing the call stack), plain view (showing slowest functions first), and Hot Spots (top 100 problem methods).
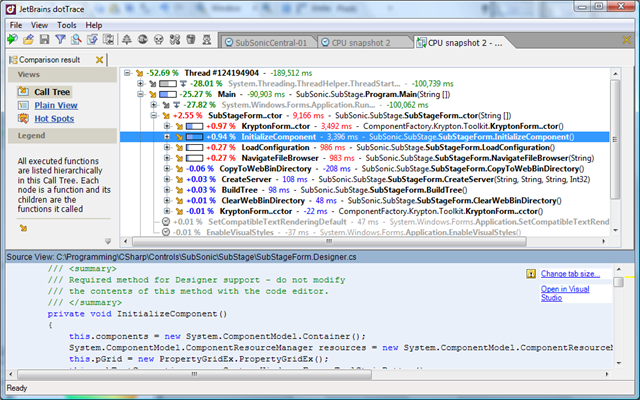
It is amazing how often some seemingly benign code will have significant performance impact. Best part, now you can find out where the problem is…and where it is getting worse.
As for Rule #1, it might take a while to figure out, but it is true. But the key to the rule, and all software development, is to have good tools to help you along. This is a good tool, and this is just the beginning of its features.
One thought on “Profiling with dotTrace”