Do you have a WPF application that just seems to be slow in some areas and have no idea on how to track it down? Enter the WPFPerf profiling tool. WPFPerf is a suite of performance profiling tools that allows you to analyze the run-time behavior or your WPF application. It can also help determine the types of performance optimizations you can apply.
The WPFPerf suite has the following tools:
- Perforator ? used for analyzing rendering behavior.
- Visual Profiler ? used for profiling the use of WPF services, such as layout and event handling, by elements in the visual tree
- Working Set Analyzer ? used for analyzing the working set characteristics of your application
- Event Trace ? used for analyzing events and generating event log files.
- ETW Trace Viewer ? record, display, and browse Event Tracing for Windows (ETW) log files in a WPF user-interface format.
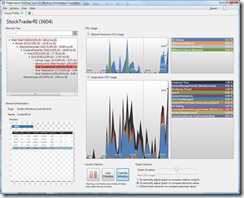
The tool I want to talk about today it the Visual Profiler. This tool is very useful for finding those bottle necks in your UI rendering. If you have complex forms or user controls, this tool really helps narrow down what is causing the problems to the specific element. So lets take a look at the Visual Profiler interface.
As you can see it has a nice clean and easy to read interface. So how do you use this thing you ask, well easy. First you need to either Select or Launch the process that you want to profile. You do this under the Actions menu item.
If you choose Select Process a dialog appears with the processes available to choose from. Don?t worry, you won?t get every process that is running on your computer, just the ones you can profile. Once you have attached a process you will start seeing all the magic happen.
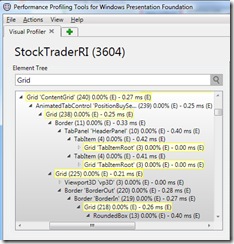
If you want to search your element tree for a specific element then just type in your element name in the search bar. All matching results will appear in yellow.
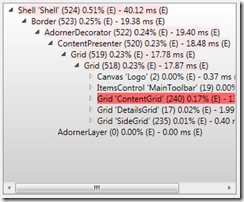
As you start click around you application you will start to notice that in the element tree some elements that are taking the most CPU start to become a brighter shade of red. The brighter the red, the more CPU it is using.
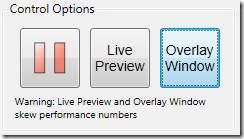
Another cool feature is the Overlay Window option in the Control Options group box.
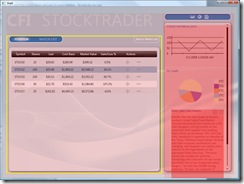
The places a color coded overlay on top of your running application showing the performance issues you may be having.
Any element you have selected in the element tree will have a yellow focus ring around it in the overlay window. The different shades of red will show you where the most CPU is being used.
There is some decent documentation on using this tool, plus all the other tools included in the suite, on MSDN. So where do you get this cool profiling tool? Well it comes with the newest Windows SDK or you can just get it here. Download it, play with it, and make your WPF apps scream with performance, or not scream because your app is so performant that it is running in stealth mode so its? processes are undetectable to your pc. Well, you get the point.

And here I thought the performance issue was the fact you’ve chosen to use WPF. *Sorry, couldn’t resist.* 🙂