.net Compact Framework is known for missing several ?features? that regular .net developers take for granted. One if the ready availability of profilers. dotTrace, ANTS Performance Profiler, Team Systems Profiler (check out Visual Studio 2010 version of this?much better). There are other profilers out there, but those are the three I am most familiar with.
What all of those have in common is that none of them will profile .net Compact Framework. But I found a profiler yesterday that does, plus it is free: EQATEC Profiler.
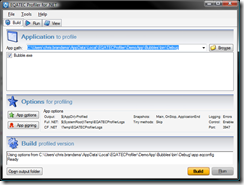
 The basics of how to use this profiler is to ?point? the profiler at your application (the executable, not the source), then use the Profiler ?build?. What happens here is the profiler modifies your executable to include new tracing/logging for the profiler, but in a different directory (a *-Profiled directory).
If you look in the Profiling options you will see a directory where the profile logs are written. Note: the log is an xml file in the form of an *.eqlog file.
Now, if you are running a plain-Jane .net desktop executable, you can just click run and start profiling. If you are running a .net cf executable you need to do a little more work. The little more work is connect your device/emulator to you operating system, and copy the profile-enabled executables to the device. Then manually run the executable on the device. Once done, find the *.eqlog file on the device and copy it to your host machine. From there you can simply double click the log file and analyze the results.
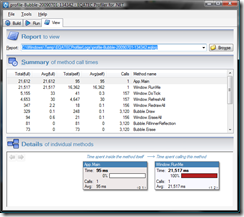
 Here is what you get in return. The report includes:
- Total(full)Total number of milliseconds a method took to run in each case. Includes calls to child methods
- Avg(full) Average number of milliseconds each call of the method took to run
- Total(self) Total number of milliseconds a method took to run, excluding child calls
- Avg(self) Average number of time the method took per call
- Calls ? Total number of calls to the method
- Method Name (why is this last?)
Note: go to the Help page for more details.
The pretty picture in the Details portion of the UI is an interactive call stack browser.
OK, so is this enough? Yes, but it is 100% that what I was able to get. Even though the results are somewhat simplistic, it is still very useful. I was able to find where I had some performance problems. I would love to have a UI to compare profile runs, but this will do for now.
One other thing this profiler does not do is Memory Profiling (NetCFCLRProfiler.exe, once installed, found at C:\Program Files\Microsoft.NET\SDK\CompactFramework\v3.5\bin). Fortunately there is one in the Power Toys for .Net Compact Framework 3.5. If I get some time I?ll go over that one later.
Also, for further info on profiling .net cf applications, check out this post by David Kline.
Thanks for the nice review – as a developer of the profiler I’m glad you’ve found it useful.
The method name is deliberately shown last to give the names as much room as possible as they can vary a lot in width, and auto-stretching the last column does not appear intrusive.
Also, the profiler can actually connect remotely to your device and fetch/show the log-files that way (and take timing-snapshots at runtime, too) so you don’t necessarily need to copy them by hand from the device. The only required manual step is the deployment and start of the profiled version to the device.
Pingback from http://www.truewill.net/myblog/index.php/2009/08/09/free_net_profiler