A long while back I posted that IE8 was shipping with a new Developer Toolbar that was very similar to FireFox?s Firebug.? Now that I?ve had several month to play with each, I thought it was time to comment on the two of them.
First off: both tools are wonderful.? If you are doing web development (JavaScript heavy or not), do yourself a favor and install BOTH of them.? If you are using IE7, upgrade.? If you are using IE6 ? may the gods be merciful on your soul.? Actually, let me restate that: There are no redeeming qualities to IE6 as to put up with it except by threat of violence.? Get rid of the beast.? (Then download the IE6 vm from Microsoft).
I know .Net/C# developers that almost refuse to help you unless you have ReSharper installed.? Same goes for web developers these days.? You need IE8 and FireFox+FireBug.? It is that important.
Moving along then.
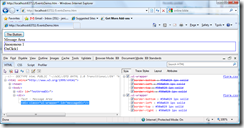
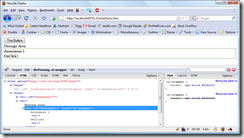
Getting started with either of them is fairly similar.? F12 is your friend.? Click F12 and you will get on of the two displays below.? You see color coded html, code folding, and display of css style information.
OK, to write everything out would take too long.? Here is a breakdown:
* Uses 3rd party web site
** Available in other areas of the application
*** Technically you can?but you really don?t want to.
You can see that there are a number of features missing from each tool.? That said, I think FireFox+FireBug has an advantage right now, mainly for YSlow, the Console Tab (displays web service traffic), and the Net Tab.? Those three are huge.? For the items that FireFox+Firebug are missing, you should probably install the Web Developer Toolbar for Firefox.? I tend to install both of those on every machine I own.
For IE8, the fact that you can switch between IE7 and IE8 mode, Standard and Quirks Mode is also huge.? The built in Html/CSS validation doesn?t hurt either.? But what really shines in IE8 is the built in tools.? Color selection, Cache Management, Outline, Image, etc.? To get those in FireFox you need the Web Developer Toolbar for Firefox.? To see the web service traffic in IE8 (that Firebug gives you), you need to get Fiddler2.? Actually, you should have Fiddler for both browsers.
But what about those other browsers:
Google Chrome: Chrome has its Developer menu which contains a primitive set of the features listed.? It is missing quite a bit, but it is able to view html, css, and JavaScript, debug JavaScript, modify css on the fly, and a few other items.? All things considered, it isn?t bad, but Chrome is well behind the other two browser for functionality.
Apple Safari: Lions and tigers and bears ? oh my!? Test in Google Chrome.? Hope it works in Safari.
EDIT: I was show the error of my ways with Safari.? Safari does have developer tools ? and they are EXACTLY what you get from Google Chrome, plus some extras.? Which makes sense, after all the two browsers use the same code base ? but come on, at least get some new icons!
But to find the developer tools, you have to show the menu bar.? Then go to preferences, Advanced Tab, and check ?Show Develop menu in menu bar?.?? Next go to the Develop menu and select ?Show Web Inspector?.? Actually, check out everything in that menu.
What do you get: you get a better JavaScript debugger than what Chrome has.? The Resources tab works.? A profiler (nice touch).? But there is this Databases thing that I know nothing about.
I still don?t think Safari is better than Firefox or IE8, but it is an improvement on what you get with Chrome.
Opera: I had some trouble getting the Opera tools to work.? Could be me.? But all said and done, the tools you get are serviceable.
And the winner is?
You the web developer, who for years has toiled away in the archaic knowledge of proper alert placement.? You win.? Both these tools are wonderful, I just wish we had them long ago. That said, it is hard not to give FireFox+FireBug a slight advantage in this race.
EDIT: Since the initial publication, Mozilla has released the Web Developer Toolbox Collection
https://addons.mozilla.org/en-US/firefox/collection/webdeveloper
This includes Firebug, YSlow, ColorZilla, Web Developer Toolbar, and more.? Please just get the collection.


A nice comparison.
I will say that IE Developer Toolbar is one of the best things Microsoft has done for development without “both” blatently ripping off a competitor *and* cocking it up. (I’m guessing it is a rip-off, but they didn’t screw it up. )
)
Might consider a “Useful Factor” rating in the table for differences to show the huge benefits from the hardly missed ones.
@Steve: good call. Added a Usefulness column with stars to the grid.
Let me know if you disagree on any of the ratings.
I still hate the javascript debugger in the IE8 bar. I think technically the best js debugger in terms of discovering the location of the executed js and being able to break there on an error is the classic Microsoft Script Debugger. In some cases even better than Visual Studio. Of course, it looks like crap and you have to use notepad and the clipboard to do anything. VS is better in every other area, but sometimes it just can’t find the code location correctly.
Firebug is a little unwieldy, but I’ve never had debugging issues with it. Albeit, I rarely use it.
Nitpicking: that’s Firefox and Firebug, not FireFox and FireBug.
Otherwise, the article is very interesting. I wish I have a computer powerful enough to support VirtualPC and the IE images (yes, my computer is old!). Thanks for the link, it might be useful someday.
Hey Chris, good comparison, but you missed one huge (IMHO) feature of Firebug. When you hover over an HTML node in the viewer, it highlights the element and shows the margins and padding in different colors. This has saved me so many headaches, I can’t imagine working without it.
Chris –
Have you encountered the IE8 Developer Toolbar not loading styles for some sites? I’ve had issues with seeing CSS data for local and some of my intranet sites.
-Damien
Uhm… as for the Safari part.
Did you know that actually Safari has built in development tools?
Enable it from preferences->advanced and check show development tools on the bottom.
@Skinn3r: no wonder I couldn’t find it when it is buried that deep. I’ll update my more enflamitory language out.
Good comparision. Haven’t used IE8 though, but have been a great fan of Firebug + Firefox. When combined with other web development tools, Firefox could easily become a web dev IDE!
All of those No’s that you encountered are alleviated by the other addons that are almost ALWAYS accompanied with Firebug: Web Developer Toolbar, and User Agent Switcher. And then you can add another group “Extensibility” Since it will have none, yet there are things that Firebug can do that IE8’s developer toolbar will never be able to do unless Microsoft opens it up. Firebug FirePHP = PHP debugging in Firebug, Firebug YSlow = Speed tests, etc. inf.
I also find that while the article is nice, it lacks a mention of the “Web Inspector” in Safari. I personally use Firefox for web browsing, but I use “Web Inspector” to debug pages, since it works much better for me than Firebug(and faster too). In fact, it is the main reason (besides testing webkit) I have installed Safari in Windows.
Some links: (note the first is from 2007, so this has been available for quite while now)
http://webkit.org/blog/108/yet-another-one-more-thing-a-new-web-inspector/
http://webkit.org/blog/197/web-inspector-redesign/
All the features that you have as missing in the Firefox column are available as add-ons through the mozilla website just like how the IE-dev tool bar was available as an add-on for IE7. While this makes developing for IE easier, the biggest ease-of-development enhancement for IE has been that IE8 works better than IE7. I will still recommend Firefox to people though. Firefox is what I develop for, with compatibility testing in IE only, so why should I not advocate Firefox.
I’m using google chrome and I’m very happy! Recommend it for all IE users!
Steve,
http://buyviagrapills.co.uk/
Another Firebug feature very useful for me: Ajax Request debugger.
yeah the fact that firebug has been handling ajax processing and debugging is kinda big. and the number of additional debugging systems i can download for firefox, which firebug is just one of them. but the ajax thing seriously is huge. something you will not see ie ever do: shows you your post and header data, shows you return status, shows you xml response, allows you to inspect xml response in dom for malformed. Also evaluate load times of elements on the page. Also see full html render that includes all linked css and js files in one navigation screen. Also highlights the area on the live page while you click its code side counterpart in the code window. Also the dom inspector all by itself as something this developer tools does not do. i had my hopes up that ie8 would actually be useable. big let down.
oh yeah and my favorite. you get a js error reported in firebug and you click on the line number and it takes you to that spot regardless of script location. in ie 8 developer toolbar – source code is not available for this location. poor microsoft…its just too hard for you. wheres the sourcecode at…. the browser side knows where its at because it tried to run it, why not the toolbar??? awaiting ie9 for now
nice comparison. i use firebug lite for chrome and ie6. they are not exactly what ff firebug is, but still they surve well.
Another thing that is a bonus for FireBug is additional FF plugins designed specifically as plugins for FireBug. For example: Firecookie, which gives you a very handy Cookies tab in FireBug and provides good cookie handling right there, and CodeBurner for FB, which adds a very handy reference tab in FB. There are others too, their usefulness depends on your needs. Also, and it might be because I’m fairly new to IE8 so if it does this, maybe I haven’t found it yet — but in FireBug, when you console.log an object, it gives you a clickable link that takes you to the DOM browser so you can see the constituent parts of that object which I’ve found absolutely vital in writting OO JavaScript applications. Also, clearly, IE8 seems to have immulated the console commands from FB, so no more errors or try/catch to prevent them… yay!
Still toying with IE8 dev toolbar, and while it seems a bit inferior to FB, it does appear to be a massive leap forward for Microsoft (probably because they paid attention to the Open Source community for a change… wish they did more of that!)
There is a color picker as a third-party add on for FireFox: http://www.colorzilla.com/firefox/
So I think that makes it a Yes * ?
Where’s the best download for the ie8 tool?
I think that IE8 Developer Toolbar is very bad than FireBug. Uncomfortable !!!!